U.S. HOUSING DEMAND TWO DECADES AHEAD

One year ago, I evaluated the changing face of U.S. housing demand — looking a decade ahead. A key finding was that aging baby boomers age 75-84 can be expected to represent the #1 source of net housing demand across the U.S. through to 2029. That year ago blog is available by clicking on this link for:
The Changing Face of U.S. Housing Demand.

This current post carries that analysis one step further — addressing the question: What then will be the changing face of housing demand two decades ahead? The story-line for the next two decades might best be summed up as housing famine, then feast.

Three preliminary conclusions emerge from considering U.S. housing needs not just over the 2020s, but into the 2030s:

  • The housing market will be whipsawed by the aging and then dying baby boom generation over these two decades — with extraordinary demand in the 2020s followed by a potentially glutted market in the 2030s.

  • Addressing the rapidly changing dynamics of baby boomers will help to smooth market function for other age cohorts — especially the large millennial cohort who today are scrambling for affordable and increasingly family-friendly housing.

  • Finally, shifting to a mix of more rental and less ownership product can facilitate more efficient market response than likely will otherwise be possible.

Review of 2019-29 Forecast

As noted, the #1 finding of the earlier analysis covering our current decade is that aging baby boomers age 75-84 represent the single largest source of net household growth from 2019-29. As illustrated by the following graph, this older boomer cohort age is followed by younger boomers age 65-74 as the 2nd largest source of housing demand (by age of householder).

Note: This forecast assumes in-migration to the U.S. represents a 3.4% increase in population each decade. A similar assumption is applied to the 2029-39 projection below.

Taken together, those age 65-84 can be expected to account for an estimated 94% of the net change in housing demand — for an added 9.7 million households nationwide — over this current decade. Millennials age 35-44 represent 26% of added household demand. Other working age adult cohorts of those under 34 and those 45-64 represent flat or declining shares of U.S. housing demand.

So, What About Two Decades From Now?

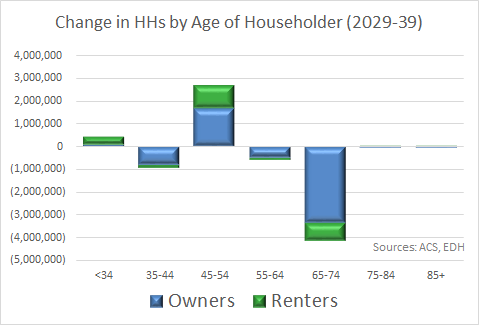
From 2029-39, the U.S. housing market takes another abrupt turn — as illustrated by the following graph.

Three key findings are of note:

  1. Over a 2-decade horizon, all household age cohorts (except those millennials who are by then age 45-54 and a small number of those under 34) will represent declining household demand. Baby boomers who all will be passing through their 70s and 80s will no longer represent a source of household growth as those who graduate into this age cohort will be offset by generally older counterparts facing mortality. Retirees age 65-74 will represent the largest reduction in net housing demand as the previously large cohort of aging baby boomers is offset by a much smaller population of maturing Gen X householders.

  2. Total housing demand will shrink from a need for an estimated 9.7 net new housing units in the current decade to a net reduction of 2.6 housing units in the following decade of 2029-39. If this scenario plays out consistent with current demographic trends, the nation’s current housing shortage will be replaced by housing surplus.

  3. Finally, as visually depicted below, the housing surplus that emerges from 2029-39 can be expected to be greatest for owner-occupied units — while rental demand two decades out remains essentially flat.

Implications

Detailed discussion was provided by my prior blog post of implications of the 2019-29 housing demand shift now underway. What are we to make of the initial outlines of what might emerge in the following decade of 2029-39? And how are these two decades to be addressed in their totality?

First and foremost, it is clear that the U.S. housing market will be whipsawed by the aging and then dying baby boom generation (those born from 1946-64) over these two decades. Potentially exacerbated by renewed inflation and increased interest rates, it appears increasingly challenging to keep up with extraordinary housing demand now being experienced through the 2020s — only to be followed by market glut in the 2030s. Making these market transitions less abrupt and financially wasteful should be an objective of both private industry participants and public sector policy initiatives appropriate now and in the years ahead.

Second, addressing the unusual dynamics of the now intense followed by fading baby boom dynamic will help to smooth market functionality for other age cohorts — especially the also large grouping of millennials who today are scrambling for affordable and increasingly family-friendly housing. The sooner that boomers can be enticed out of large single family home-ownership product into other existing right-sized and/or new innovative senior housing offerings, the easier it will be to serve other market demographics with less risk of long-term single-family residential overbuilding.

Third and finally, while home ownership likely will remain an important part of the American dream for generations to come, shifting to a mix of more rental and less ownership product can serve to facilitate more efficient market response than would be otherwise possible. Rental housing fits more with an ever more urban demographic profile of the American housing and can more rapidly be built, adapted from other uses and/or removed from the housing inventory in response to changing market conditions than single-family ownership product.

For comments on this blog post or to request inclusion on my email notification list for future E. D. Hovee blog posts, please email me, addressed to: ehovee@edhovee.com

Also note: A listing of and links to past blog posts is available at:
Blog Post Listing.

LABOR FORCE DEEP DIVE (Part 2)

In my last blog of September 15, Part 1 analysis inovlved a one-decade look-back at labor force and jobs, focusing in on declining labor force participation pre- and post-pandemic. For those who missed the introductory overview of Part 1, you might click here to see the earlier post.

Now with Part 2, we dive a bit deeper. Topics covered include:

  • A state-by-state overview of labor force participation — currently and over the last decade,
    followed by consideration of participation rates by

  • Age of adult population and other pertinent characteristics as for sex, race/ethnicity and children at home,
    ending with

  • The elephant outside the room
    and what to do??

Part 1 focused on the question of getting labor force participation rates back up to where they were a decade ago. This Part 2 posts observes that, even if successful, recovery of labor force participation likely will solve only about 25-30% of the current labor shortage. And the even more unwelcome news is that as long as the workforce supply gap persists, inflationary pressures will also continue.

Let’s get started.

State-by-State Review

This state-by-state review starts with a mapped look at comparative labor force participation rates as of 2021. As shown, Nebraska comes in as #1 — with a labor force participation rate estimated at 70.2% of working age adults age 16+. Other states in the top 5 are North Dakota, South Dakota, Colorado and Utah. respectively. Rocky Mountain and plains states leading the way.

At the bottom of the list is West Virginia with a labor force participation rate of less than 55% — followed by Mississippi, Alabama, Arkansas, and New Mexico. Interestingly, the states both at the top and bottom rungs of workforce participation tend to be rural or with large rural expanses.

Perhaps more noteworthy is a second pass at the map — this time for a comparison of changes in labor force participation from before the pandemic (2019) to recent recovery experience (2021). Somewhat surprisingly, Oregon comes in #1 — increasing its labor force participation rate by 0.7% points from 2019-21. Only one other state — Alaska — has experienced increasing labor force participation over this pre- to recovering pandemic period.

Forty-eight states have experienced declining labor force participation since 2019. Vermont comes in 50th with a 5.9% point decline in labor force participation in just two years — followed by Connecticut, Nevada, Iowa and Virginia also losing significant workforce participation. There appears to be no immediately clear sense of what, if any, characteristics that these states share in common that would explain their uniformly weak recovery experience.

Labor Force Participation by Age

We now take on perhaps the most intriguing characterization of labor force participation — by age of worker over the full period of January 2012 - August 2022. At first blush, there is little that would seem out of the ordinary as depicted by the following graph.

Not surprisingly, the three age cohorts with, by far, the highest labor force participation rates are those in career building age categories of 25-34, 35-44 and 45-54 — all with participation rates in the range of about 80-85% of the populations in their respective age cohorts.

Those age 55-64 show some dis-attachment from the work force — with workforce participation rates dropping to the 65% +/- range. Entry level workers age 16-24 have yet lower participation rates in the range of 55% (with large proportions still in school).

And not surprisingly, those age 65+ show the least continuing attachment in the range of 20% or lower participation rates. We’ll circle back to this cohort in a moment — for the rest of the story.

All age cohorts experienced some temporary loss of workforce participation during the pandemic but with general recovery thereafter. Although workforce participation for all adults declined by 1.3% points from 2012-22, participation increased for every single age cohort 16 and over — with the greatest increase of 2.1% points over the decade noted for those age 25-34.

How can it be that participation declines for the overall population age 16+ but increases for every age cohort from 16-24 to 65+ (and all those in-between)? The rest of the story answer lies with the outsize cohort of aging and retiring baby boomers. Put succinctly, the number of baby boomers now retiring far outweighs the number of new labor force participants age 16-64.

Other Defining Characteristics?

Before getting to this story’s conclusion and its implications, it is also useful to consider other characteristics of labor force participation — including sex, race/ethnicity and presence or absence of children at home.

Sex & Labor Force Participation

As has long been the case, men continue to have higher rates of labor force participation than women. However, that is changing. Over the 2012-22 period, an average of just under 69% of men age 16+ were in the labor force as compared with close to 57% of women. However, over this period, men’s participation rate declined by 2.4% points while that of women declined by just 0.6% points.

Influence of Race/Ethnicity

With a labor force participation rate of over 66%, Hispanic/Latino adults are the most work oriented, followed by those who identify as White at just under 63% and African American/Black at between 61-62%. Over the course of the last decade, the Black participation rate has increased by 0.7% points — above that of Latinos (up by 0.5% points) and then Whites (for whom participation rates dropped by 2.1% points).

Presence/Absence of Children @ Home

Contrary to what one might expect, households with their own children (under 18) at home tend to have higher rates of labor force participation than those with no children in the household. Over the last decade, labor force participation rates averaged 81% for households with children versus 57% for those with no children at home (likely due in large part to being at or closer to retirement than for those with no children present in the household).

Also surprisingly, parents with children under 6 years of age are almost as likely to be in the workforce as those with older children. In the last decade, labor force participation has increased for households with children while declining for households with no children.

This shift has affected even households with very young children (less than 1 year of age). For example, over the last decade labor force participation rates for women with a youngest child under 1 year has increased by 5.3% points, the most significant change for any of the child/parent indicators tracked by BLS.

The Elephant Just Outside the Room

For the past several decades, the baby boom generation (born between 1946 and 1964) has been the elephant in the room — supporting strong growth in labor force and employment. Now the elephant is leaving the room — with only those born between 1957 and 1964 still at or under 65 years of age.

Those who are over 65 seem to be following in their parents footsteps — with labor force participation rates dropping from 73-74% (for those 65 and under) to 19% or less (for those now over 65 years of age). The boomer elephant is now leaving the room — with generally smaller generational cohorts coming in behind.

The following graph compares changes in the distribution of the nation’s population and labor force over the last decade. As illustrated, persons age 65+ accounted for 73% of the growth in the nation’s population (of those 16 and over) from 2012-22. Despite ensuing dis-attachment of many due to retirements, this senior cohort still accounted for more than one-third (34%) of the U.S. net labor force growth over this last decade. Who’s to fill the gap after boomers move into their 80s (now just four years away for those born in 1946)?

Source: U.S. BLS.

Those age 55-64 (including some younger baby boomers) also accounted for more growth in labor force than in population. And those age 25-44 (largely millennials) have contributed both to added population and even more to the nation’s labor force.

The situation is more challenging for the much smaller Generation X cohort as illustrated by the age 45-54 group on the graph. From 2012-22, both the shares of population and labor force of those age 45-54 declined. And the contribution those at the youngest (16-24) end of the age spectrum has been essentially flat — providing no net added contribution to American workforce over this past decade.

My earlier Part 1 analysis of labor force trends indicates there are about 2.3 million fewer Americans either working or looking for work than would have been the case if labor force participation rates of 2012 were still in place. This Part 2 analysis shows that the challenge is even more intense than just loss of historic rates of labor force participation.

This Part 2 review indicates that America’s labor force increased by about 10.3 million from 2012-22. The number of jobs increased even more dramatically — by 18.8 million — with the difference due primarily to reductions in unemployment to record lows. However, this came at a price. Labor force growth fell short of the job increase by 8.5 million.

With historically low unemployment, the slack in the nation’s workforce is now essentially used up. Going forward, net growth in employment is likely to depend on something more like a 1:1 ratio of labor force to job growth (versus the 0.55:1 ratio) on which the U.S. economy relied over the last decade.

With the previous slack used up coupled with weakened demographics of population aging and resulting slower workforce growth ahead, there are few ready-made solutions on the horizon. So, what to do?

What To Do?

Looking ahead, there appear to be two possible strategic responses to the impending transformation of America’s job engine, either by:

  • Increasing workforce supply
    and/or

  • Reducing workforce demand

Here are some thoughts as to potential policies or implementation measures that might be employed for each of the two broad strategic approaches considered.

Increasing Workforce Supply

Increasing workforce supply could involve some combination of potential measures including:

  • Attracting back the estimated 2.3 million workers who appear to have left the labor force over the last decade — both before and during the pandemic — likely involving some combination of measures such as better pay, more flexible work hours and at-home work, supportive child care, health safety protections (as for immuno-compromised), and better articulated opportunities for on-the-job training and career advancement
    (though best case, this measure on its own solves only about 25-30% of the labor force/job mismatch).

  • Increasing birth rates — though it will take a generation (about 20 years) to realize the payoff.

  • Increasing part-time, contractual and volunteer work opportunity for those preparing to retire — focused both on those currently in the 55-64 and 65+ age cohorts.

  • Providing more flexible work options for market segments with historically low rates of participation — as for parents with young children

  • Encouraging in-migration — especially for those bringing skills in short supply into the U.S. and by offering clearer path for longer term stays and citizenship

Strategies for increasing workforce supply offer the best opportunity for success if accompanied by reasonable social and political consensus for continued U.S. population and economic growth with ever greater cultural diversity.

Reducing Workforce Demand

Strategies for reducing workforce demand are dependent on transitioning to a society that can do more with less through measures such as:

  • Induce recession with increased unemployment as the Federal Reserve is clearly poised to risk — but this is only a short-term (and rather painful) solution for the duration of the economic downturn.

  • Greatly ramped up investment in automation and robotization — especially for employment sectors involving rote work or lower paid service occupations (offset by new found worker opportunity to upgrade by transitioning to occupations that pay more)

  • Reducing the accepted work week from the traditional 8 hours/day, 5 days/week schedule — as the benefits made possible by a more affluent society allow opportunities for more time for societal leisure and independent personal pursuits

  • Parallel adoption of some form of universal basic income (UBI) providing all Americans with a base level of compensation — adequate for day-to-day needs accompanied by incentives whereby working is always more remunerative than not (though if improperly applied this measure could exacerbate employment woes by increasing rather than reducing demand for goods and services)

  • Simplifying rules-based and means-tested administrative and revenue mechanisms so there is less need for employment bureaucracies and enforcement in both public and private spheres of economic activity

  • Investing in technology platforms readily accessible in the full range of personal, social and economic pursuits

Strategies for reducing labor demand may prove challenging to achieve widespread public and institutional acceptance. However, if adopted, strategies aimed to right-size the scale of human effort required in a more widely affluent society offer prospective benefits of greater individual, community and cultural choice for generations to come.

Most likely, the strategic mix pursued will involve some combination of supply enhancement and demand reduction measures — involving both market led and regulatory initiatives coupled with trial and error, rewarding and building on what’s demonstrated to work.

The not-so-fortunate reality is that the workforce supply gap is not likely to be solved overnight. As long as it persists, upward inflationary pressure also will continue — independent of actions the Federal Reserve may take in the here and now. All the more reason to begin addressing the longer term labor supply gap — the sooner the better.

LABOR FORCE DEEP DIVE (Part 1)

What’s happened to American workforce? Where have the workers gone? Along with inflation, these questions have become top of mind challenges across the U.S. — the new economic challenges post-COVID-19 pandemic.

While there’s as yet no silver bullet answer, this might be a good time to sift through the detail, piecing together the mosaic. This blog is intended to graphically and succinctly characterize the changing nature of labor force participation over the last decade. This is Part 1 of a 2-part blog post with this Part 1 providing:

  • Introduction - a one-decade look-back at labor force and jobs

  • Review - declining labor force participation

  • Summary - reduced workforce by the numbers

Note: All data used for this post is from the U.S. Bureau of Labor Statistics (BLS), based on monthly records extending back over this past decade.

A One-Decade Lookback @ Labor Force & Jobs

In January 2012, the U.S. had a total labor force of over 154 million with total seasonally adjusted employment of 141-142 million. Just over a decade later, as of August 2022 the nation’s labor force had increased to nearly 165 million with 159 million employed.

Looks like great progress. Well, not quite. We all know something is amiss. So get ready for a quick deep dive into the numbers.

What we see is that declining labor force participation has been an emerging trend going back over at least the last decade. And that the pandemic together with incomplete workforce recovery served to accelerate and intensify a now readily apparent shortage.

As shown by the following graph, despite the sharp but temporary downturn of the 2020-21 pandemic, America’s labor force is now 6% above 2012 levels and employment an even healthier 12-13% above pre-pandemic levels. The concern is with a decline in labor force participation which has been reduced from from as much as 63.8% to 62.4% of the civilian population age 16+ (as of August 2022).

Source: U.S. Bureau of Labor Statistics (BLS).
Monthly employment and labor force data for persons age 16+ is seasonally adjusted.

From 2012 - February 2020, employment across the U.S. had increased by 11.5%, nearly double the 6.4% increase in available labor force over the same time period. Existing slack was removed from the labor force as unemployment was reduced from 8.3% in January 2012 to a below normalized rate of 3.5% as of February 2020 (just prior to intrusion of the pandemic).

What’s remarkable about the 2020-21 pandemic is the exacerbating effect that temporary layoffs had on the labor force. From March - April 2022, over 25.5 million jobs were cut from employer payrolls. And about 8.2 million Americans exited the labor force, at least temporarily not seeking work. In effect, nearly one-third of massive pandemic layoffs were accompanied by persons leaving the labor force altogether.

With initial recovery in the summer of 2020, a good portion of these jobs were recovered quickly — with the U.S. back to full job recovery (to pre-pandemic employment) as of late summer 2022.

However, labor force recovery has continued to lag well behind job growth. Over the full time frame from January 2012 to August 2022, U.S. employment has increased by 12.8%, still about double the 6.6% increase in labor force. What’s particularly notable is the pattern of the recovery from April 2020 - August 2022 — with available labor force up by 5.3% versus an employment gain (or recovery) of 17.6% (meaning an even wider gap between workforce supply and demand)..

Re-entry of discouraged or marginalized workers occurred more slowly — lagging well behind employment growth. This has led to current low unemployment rates and to increased competition for an increasingly constrained labor pool — especially among lower-paid service workers.

Declining Labor Force Participation

So, what’s the worry?

As illustrated by the graph below, the concern is with the short and potentially longer-term effects of a decline in labor force participation which has eroded, starting slowly then abruptly, over about the last 10 years.

Source: U.S. Bureau of Labor Statistics (BLS).
Participation rates as a % of civilian population age 16+ are seasonally adjusted.

After peaking at a decade high 63.8% in October 2012, labor force participation rates began to trend downward — dropping to a pre-pandemic low of 62.3% as of September 2015. Participation rates then edged upward (somewhat erratically) to a new peak of 63.4% in February 2020.

Employment and labor force both crashed in the following two months. As the COVID pandemic took hold, America’s labor force participation cratered to 60.2% of the adult population by April 2020.

As employment recovered over the summer of 2020 and then more slowly thereafter, a portion of those who had dropped out of the workforce re-entered. But with not nearly the level of work attachment as the nation was accustomed to pre-pandemic.

As of August 2022, labor force participation has now reached a post-pandemic high of 62.4%. However, this is still well below the pre-pandemic high of 63.8%. And while a 1.4% point difference between the high and low participation rate may seem relatively trivial, this difference equates to a cumulative loss of 2.3 million workers over this approximate 10-year period.

It’s increasingly questionable as to whether workforce participation ever get backs to prior the strong levels of a decade back. This appears to be for two primary reasons:

  • Retirements of aging baby-boomers,
    coupled with

  • Some declining attachment of younger age adults to work
    (with seemingly multiple explanations)

Reduced Workforce by the Numbers

I’ll come back to more detailed discussion of reasons for declining labor force participation in Part 2 of this blog post. We’ll dive even deeper into the numbers looking at:

  • State-by-state experience

  • Labor force participation by worker age and sex

  • Variations by race and ethnicity

  • Children at home

I close this Part 1 post with two quick summary observations — by the numbers. First, from 2012 up to the pandemic, labor force participation across America experienced some overall slow erosion — with at least 800,000 fewer Americans in the workforce at the start of the pandemic than in 2012. So, the beginnings of de-attachment for some workers has been in the works for some time.

Second, reduced labor force participation accelerated during the pandemic. Even with some recovery through to this August, America’s workforce has been reduced by another 1.5 million. In effect, the life and livelihood altering pandemic appears to have accelerated and intensified a trend already underway.

The net result is that, today, there are about 2.3 million fewer Americans either working or looking for work than a decade ago.

Where do we go from here? Look for a Part 2 installment - now available (click here to view).

To receive periodic blog posts,
simply email me at
ehovee@edhovee.com
and say “Subscribe”

The Changing Face of U.S. Housing Demand

Much is made of the inadequacy of housing supply to meet the full range of housing demand or need in the U.S. This blog post addresses one often overlooked but key facet of changing housing demand over the current decade … housing need by age cohort of the U.S. population.

Start with America’s Aging Population …

As depicted by the following graphic, the U.S. population of persons from age 15 to 64 appears fairly evenly distributed across five age groups — of 10 years each. As of 2019, the largest single age cohort comprised of 46 million millennial adults age 25-34. This was followed by a 42 million portion of baby boomers age 55-64 — with lesser proportions in the 15-24 and 35-54 age brackets. Proportions of those 65 and over are considerably less, though the 65-74 age group is now expanding rapidly with aging boomers. But this apparent first glance sense of overall calm is best by not as clearly seen market turbulence.

Note: Source data is from the American Community Survey (ACS) as of 2019, conducted by the U.S. Census Bureaau.

Fast Forward a Decade …

The next graphic advances the analysis in two respects:

  • Comparing the adult age distribution in 2019 versus what can be expected by 2029 (starting with the under 34 cohort, then advancing in 10-year groupings up to the most senior cohort of 85+)

  • Making the comparison in terms of households rather than population (by age of adult householder)

Age cohorts with more households by 2029 (than in 2019) include those with householders age 35-44 (a good portion of the millennials) and with the aging baby boomer cohorts of 65-74 and 75-84.

There is also emerging growth in the number of of those age 85+. Other age cohorts — notably householders under 34 years of age and those age 55-64 — will be shrinking in numbers but with the 45-54 being populated now by the Gen X group remaining relatively unchanged in numbers from 2019-29.

What This Means for Owners & Renters

It’s no surprise, but householders tend to transition from being renters to owners as they get older and, generally, wealthier.

Rates of home-ownership peak out at just under 80% in the 65-85 age brackets, declining thereafter. At ages 85+, more seniors drop out of the ownership/renter categories all-together, shifting more to group quarters types of living arrangements including assisted living and nursing home facilities.

Other Factors Affecting Housing Demand

This age-cohort model not only advances those in one generation to the next (with the passage of time), it also takes into account in-migration to the U.S. and mortality (which increases at an ever faster rate for those 75+). Annual age-specific mortality is relatively low, below 1% per year for householders up to age 64, then increasing to less than 2% for those 65-74, to over 4% per year for those 75-84 and to more than 13% per year for those 85+.

For purposes of this analysis, in-migration to the U.S. is assumed to represent a 3.4% increase in population each decade. This is the add-on to pre-existing population experienced as a result of in-migration from 2010-19.

Resulting Housing Demand by Age Cohort

What this means for housing demand over the 10-year time frame is illustrated by the final graph in this blog post. Here’s where the rubber hits the road.

In change unprecedented for America, aging baby boomers age 75-84 can be expected to represent the #1 source of net change in housing demand across the U.S. through to 2029. Increasing demand is next strongest for those younger boomers 65-74. Taken together, net new demand from those in the 65 and over groups may account for 10.3 million more units of housing than was required for households in these age age 65+ cohorts 10 years previously. This represents a stunning 106% of the total estimate of 9.7 million added housing units likely needed across the U.S. from 2019 to 2029.

As noted, summing across all age groups, housing demand is estimated at approximately 9.7 million added occupied housing units required between 2019-19, equating to a need averaging 970,000 new units per year (not counting normalized vacancy). This exceeds the average of about 900,000 housing units constructed across the U.S. per year over the 2009-19 period.

Millennials represent 2.5 million units (or 26%) of net added housing demand over this decade, with seniors 85 and over constituting another 1.2 million (or 12% of the increase in housing unit need). Taken together, the demand of boomers, millennials and the oldest seniors adds up to more than 100% of added housing demand nationwide. How can this be?

This occurs as householders age 55-64 will need 2.2 million fewer units than those in that age bracket 10 years earlier. This is because the 55-64 age bracket is transitioning from numerous younger boomers (in 2019) to far fewer Gen X householders by 2029.

Also noted is that the under 34 age cohort represents a figure approaching one million fewer householders in 2029 than in 2019 (as numerous younger millennials are replaced by a smaller number of Gen Z householders). And the age 45-54 cohort will represent a cross-over grouping with numbers of householders likely to be little changed over the coming decade.

Summing across all age groups, over 70% of net added housing demand is projected to be for homeownership housing product — with less than 30% for new rental units. As has historically been the case, rentals can be expected to represent the majority of units in demand change for a (shrinking) younger than 34 age cohort and an (expanding) 35-44 age group increasingly oriented to ownership. Homeownership dominates at all other age categories — including those 85 and over who have not transitioned to group living arrangements.

Perhaps the most remarkable observation overall is that 106% of net added demand for housing units in the U.S. will be coming from householders age 65 and over. A negative demand (or market shrinking) of 6% is noted for householders under 65 — notwithstanding the important market presence of millennials who will be in the 35-44 age grouping by 2029. All other age cohorts under age 65 will represent minimal or declining unit demand over the 2019-29 decade.

Implications

What does all of this mean for meeting America’s housing needs? Several initial thoughts come to mind:

  1. By virtue of their size and family-forming ages, millennials look to be the most visible new driving force in the U.S. housing market in the years ahead. As more baby boomers begin to face mortality, those currently age 25-34 are now the single largest 10-year cohort of adults in the U.S. Later than their parents, they are now forming families with more looking to own rather than rent – also now driven away from urban to suburban locales in the wake of the COVID pandemic. Inadequacy and poor affordability of available housing inventory represents the primary impediment to meeting this now exploding market demand. Whether and how this demand is met depends, at least in part, on freeing up more of the pipeline of existing housing currently in the hands of older occupants as well as creating new and innovative semi-urban product. New housing and community designs will need to be attractive to millennials preferring urban amenity coupled with family-friendly, less crowded places also offering good career opportunity.

  2. While baby-boomers are now clearly moving to retirement mode, they will remain a potentially potent if perhaps less visible housing market force for at least the next decade. The biggest changes in the market will come from those who will be between the ages of 65-84 by 2029. The key question for this grouping and all others behind is whether and to what extent boomers will age and stay in place or move to smaller quarters – thereby freeing up family housing for younger cohorts seeking larger homes. Prior to the Great Recession of 2007-09, there was evidence of a shift by boomers to more urban and smaller quarters – as with condos. With financial collapse followed just over a decade later by pandemic, boomers appear to be more motivated now to remain in place as long as this option remains perceived as an affordable and secure lifestyle preference.

  3. As bookends to the market makers, the smaller Gen X and Gen Z cohorts should be afforded somewhat better and more affordable housing options than their millennial counterparts. Gen Xers had the opportunity to get into the market during the economic lull immediately following the Great Recession and will be well poised to have the greatest financial wherewithal to step up to the best of what the boomers vacate over the next 1-2 decades. Gen Z may be afforded similar opportunity in the wake of the millennial flight to suburbs and smaller cities – as the next wave of denizens for urban core rentals.

  4. While historically a small segment of the housing market, seniors can no longer be overlooked as they likely represent the fastest growing change in the market over at least the next two decades. Those age 75-84 can be expected to represent the single biggest growth of households in the U.S. through the 2020s. After 2030, the action shifts to an historically insignificant but soon-to-be a massively large cohort of baby boomers reaching age 85+ with unprecedented longevity.

  5. In-migrants are also not to be overlooked as they constitute a swing factor of importance – especially for rental housing. In the next decade, residents new to the U.S. will be competing primarily for affordable rentals across a range of urban, suburban and rural locales. Beyond 2030, those who arrived in the 2020s will be looking to move up – shifting toward affordable home ownership when and where possible. In terms of numbers, this market segment may be impacted (either up or down) by potentially unpredictable immigration policy.

  6. Smooth market functioning is best assured by fluid product development and marketing that proves attractive for more aging baby boomer to move and right-size rather than age in place. While understandable and often promoted by public policy, aging-in-place may represent a worst-case scenario for younger generations. The best case emerges if new housing products ranging from adult communities to high amenity urban options for independent living serve to draw more elderly out of their homes before being forced by health or financial circumstances. From the perspective of housing developers, the best options appear to be: a) more attractive and flexible residential options for boomer seniors; b) new urban-suburban and tech-focused housing for millennials, and c) continued focus on more innovative options for more units of housing affordable to those not currently effectively served by the private market.

  7. Bottom line, get ready for radical reshaping of the nation’s housing market on a scale and at a pace unprecedented in U.S. history. Communities and developers that anticipate and shape these changes should emerge as winners in the next 1-2 decades. Laggards will be less fortunate — negatively impacting residents and sustained community vitality.

Initially posted on December 18, 2021, this article is subject to subsequent revision.
To receive my periodic blog posts, simply e-mail me at
ehovee@edhovee.com and say “Subscribe”